Assignment - Programming for Data Science
This repository contains the final assignments of Term 1. It has three sections to represent different tasks like -
- README.md file preparation
- Programming Task 1
- Programming Task 2
Section - A
This is a README.md file.
About README.md file
According to the Assignment Specification Document, this file has short description of the topic related to the Programming task.
Section B
What is Correlation?
The variables are said to be correlated if the change in one variable results in a corresponding change in another variable.
For Example: The price and demand of a product is in Correlation. Important Note: Correlation lies between -1 to +1
Correlation Coefficient
The Coefficient of Correlation (r) is a measure of the strength of the linear relationship between two variables (or features) - X and Y.
| -1 | 0 | +1 |
|---|---|---|
| Strong Negative | No Relationship | Strong Positive |
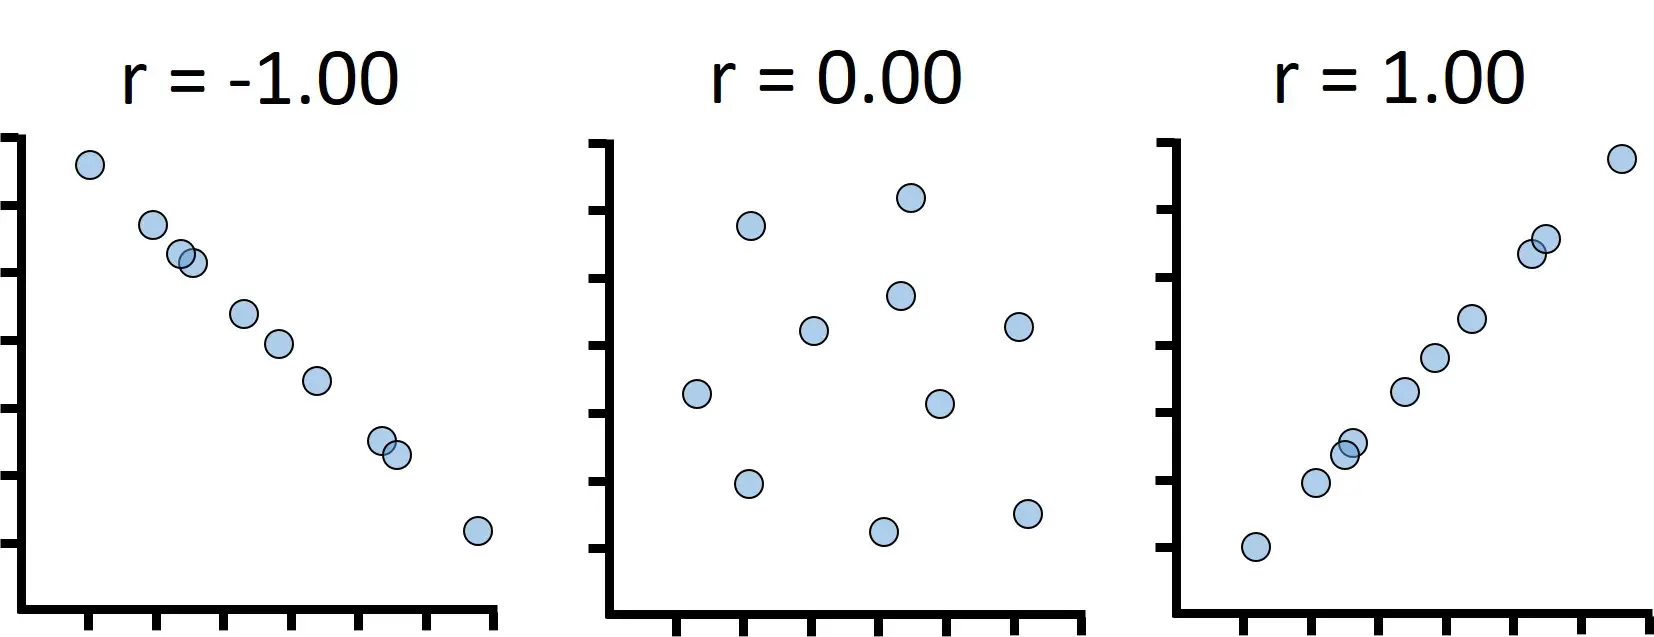
Figure 1) Correlation Coefficient
Pearson Correlation Coefficients
Pearson's Correlation Coefficient is the best statistic that measures the statistical relationship, or association between two continuous variables.
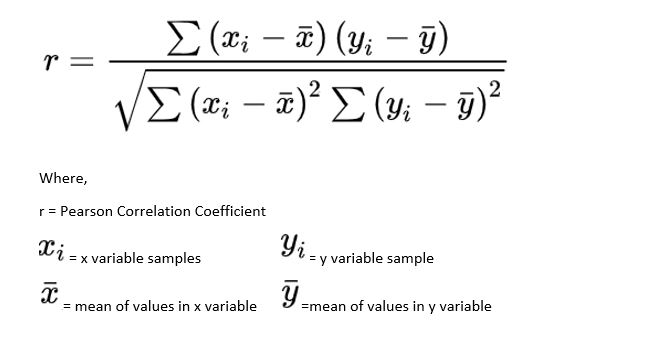
It is known as the best method of measuring the association between variables of interest because it gives information about the magnitute of the relationship, or correlation, as well as the direction of the association.
Real Life Application
- Time spent on E-commerce website vs. Money spent by a customer.
- Number of unique users vs. sales in a day.
- Measure the correlation between the patient's blood pressure and the medication used in the process.
Section C
Python Libraries
Python-written libraries are essential for data science and machine learning. A Python library's modules each serve a specific function. The code flexibility of this library makes it suitable for a wide variety of applications. This tool provides many benefits to the programmer.
Numpy
- Developed by Travis Oliphant and was released in 2005.
- Memory efficient.
- Work on Numerical data.
- Powerful tool - Array
- Shows better performance when number of rows is 50K or less.
- Capable of providing Multi-dimensional Arrays.
- Suitable for fast Indexing.
Pandas
- Developed by Wes McKinney and was released in 2008.
- Consume more memory.
- Work on Tabular data
- Powerful tools - Data frame and Series.
- Shows better performance when a number of rows is 500K or more.
- It has a higher industry application than Numpy.
Matplotlib
It is a visualization library that combines other libraries, such as NumPy and pandas, to create visual representations of data.
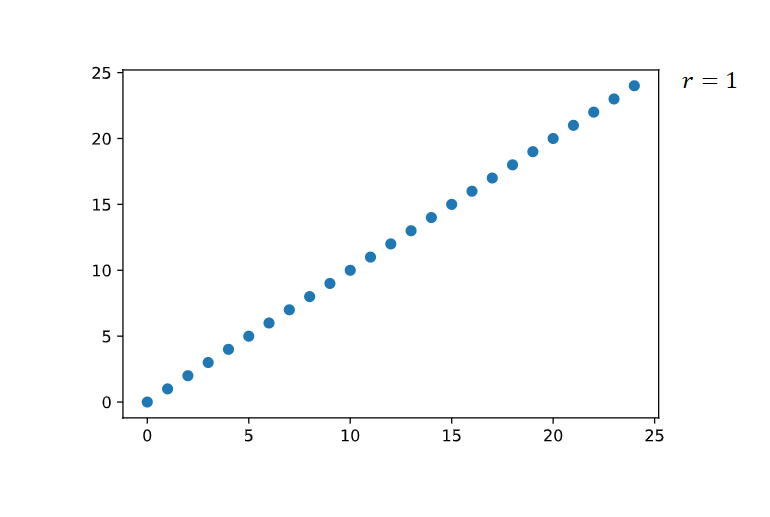
Figure 2) Visual Representation of the Correlation Coefficient.